Unlock agricultural insights and mitigate risk with PACHS

PACHS provides the most accurate agricultural data

Simplify your data analysis with PACHS’ user-friendly, customizable tools across agriculture, climate, and mycotoxin risks.
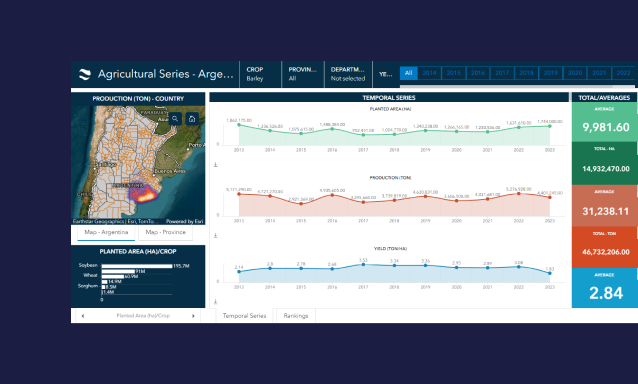
1. Agricultural series

PACHS provides comprehensive agricultural data with charts on planted area, production, and yield. Rankings are presented through bar and pie charts, with maps at macro and micro scales. Multiple filter options and indicators allow users to easily analyze trends across various crop types.

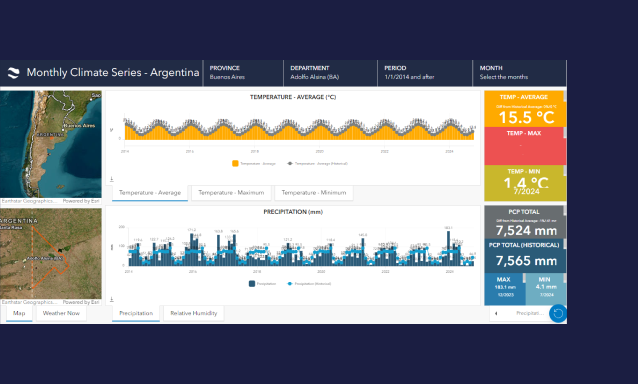
2. Climate series

The climate module combines period values and historical averages in detailed charts, offering insights through macro and micro-scale maps. Users can switch between daily and monthly layouts, apply filters, and link to real-time forecasts for up-to-date decision-making.

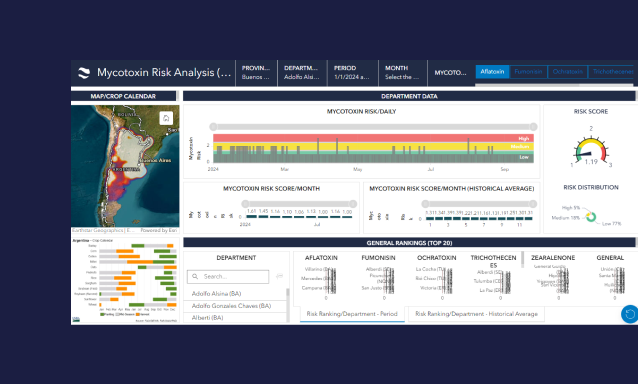
3. Mycotoxin risk analysis

PACHS delivers daily mycotoxin risk analysis, with historical and monthly charts enhanced by a score meter. Heat maps, ranking charts, and crop calendars provide a comprehensive view, allowing users to monitor and compare risks across regions.

Additional features

Georeferenced data and downloads

All PACHS data is georeferenced and available for easy download, providing accurate and actionable insights.

Regular updates for better insights

Receive weekly updates for climate and mycotoxin risks, and yearly updates for agricultural data.

Intuitive and user-friendly design

Navigate with ease through PACHS’ simple interface, designed for efficiency and accessibility.

Ready to see PACHS in action? Schedule a demo today